Showing posts with label Stock Charts. Show all posts

Saturday, October 6, 2012

Cost Averaging? or Market Timing? (a Question on Stocks Investing)

EEI stock on PSE - back when it was still about to trend higher up

A friend of mine recently asked me this question via FB:
may tanong ako sa stock investing. i'm following bo sanchez's stock updates. i buy when low. then napansin ko nawala ang gains ko because i kept on buying at buy below prices pero dahil tumataas na ang price per share, tumataas din ang average prices ko. for ex. MBT. dati ang average price ko was 69. i noticed na may gain nako na almost 50% when MBT price per share went up to over 100. but i held on to my stocks. i kept on buying and the ave price went up to 72 na and my gains were now barely 30%, also because share prices pulled back from 100 to 92. sana pala nagbenta nako nung nag 100 ang price. but i haven't sold any MBT stocks.
so i experimented today. i observed na tumaas ang FPH up to 80/share and i noticed na may gains nako na 23%. 80 is still below the buy-below price of 102. what i did was i sold all of my FPH shares and i plan to buy again when it pulls back a bit so i can start from 0, so to speak. i plan to do range trading pero guided by bo sanchez's recommendations pa din. am i doing the right strategy? i'm thinking kasi na as long as i see positive gains, that means i'm earning di ba?
that's what i did with ICT. nag experiment ako. a few months ago, i read in COL research that ICT shares are at market values at 71-75/share. so they recommended to buy when prices pull back to 67. and it did! well i bought at 67.50 and it went up to 71 kanina lang. so good move. pero i only bought up to 250 shares lang coz i was scared to lose my money so ang kinita ko was barely 600 bucks hehehe. better than negative.

Here is my answer:

Hi (friend), nice read !smile

I think for MBT, what you were doing was Peso Cost averaging right? That's actually normal, as you accumulate per month or per same period of time at the same amount, the average goes up as the price that you get to buy them also goes up. If you really want long term for MBT, then you can continue to buy and be consistent on the Cost Ave Method. Although 50% is already a very good one. smile But if MBT continues to go up in the long term, who knows? Your gains may go up 50% again.

For FPH, I think you are doing just right. Although if you plan to range trade, yes follow Bo's recommendation. Try to understand the reason why -- the reasoning is: BUY in DIPS. If it dips down low, you buy. If it goes up and reaches a peak you set as your target, you can sell. Take NOTE though -- this kind of market timing is hard, you will need in-depth knowledge or experience and application of technical analysis. YOu have to be careful -- make sure that the mid-term or long-term outlook is UPTREND (range trading is generally used for stocks on a consolidating trend). You will see it through the charts. You will really have to apply what you learn in tech analysis to get proper timing. To be extra safe, make sure you are riding on a fundamentally-sound stock. I haven't been following FPH, but from what I've heard ever since, from COL fundamental outlook, they've been consistently grading it naman as a fundamentally good company.

For your ICT -- that's good! Any positive gain is good. I've heard somebody term themselves"chupitero". But any gain in the stock market is a good gain - kahit gano pa kababa (or kaunti). Kahit pa binteng lang! So I agree with them. A chupitero is a chupitero -- he is still.... panalo! hehe smile

We may be getting gains now, but gaining in stocks is not really that easy. Once you get losses, you'll know how it feels like. But -- no pain, no gain. You may loss some, but if you know how to handle it well, and know how to use that pain to really learn something -- you will gain in experience. That is, to me, what will give you the golden eggs. wink

---------------------------------

Happy Investing to all! ;)

Friday, July 6, 2012

Jackpot on EEI

EEI stock - Philippine Stock Exchange Market (PSE)


Notes on EEI CORPORATION stock - July 4, 2012

EEI Corporation (PSE Stock Code: EEI) has very good fundamentals (huge line-up of projects in the future and made ~80% jump on profits this year). I bought it at Price P6.2/sh last 6/28/2012, now it's at 6.65 and I have a gain of 6.76% after a week. A look at Technicals also helped.

Will set up my price stop targets.. but contemplating on concentrating it more on a long-term (maybe on cost-averaging mode na lang). Hopefully it resumes its uptrend. It's still on HOLD status by COL (CitisecOnline) since 6/18, but technicals seems to show a different thing.

RSI (entering ~70%) seems to show it's nearing overbought levels, but this could be temporary. MACD is picking up, as well as Volume (it seems). Still need more in-depth work & study on this to get to figure out the outlook better. But uptrend looks very promising.

Seems like I'm winning (timing na timing!). I got it just before it went straight up. I wished I stacked up more cash for this - but that's how stock investing is: you will never know if you did the best thing when you start a bid (because there are risks), but you will get to decide or know, or learn, days or weeks after if it was indeed a good choice. You can trust your instincts; but experience, continuous study and vigilance will really help in a long way.

Entered this on my Stock Market Journal (for Philippine Stock Market).

Thursday, March 29, 2012

The 2 Stock Market Approaches that Most People Don't Know About [and how we can use one of them to evaluate a Solar Investment] - Part 2


Hi everyone!

I sincerely apologize for having gone for so long, when I promised I will expand further on my earlier post:
The 2 Stock Market Approaches that Most People don't know about [and how we can use one of them to evaluate a Solar Investment] - Part 1.

It takes time for me to write, it can be mentally and emotionally draining because I write not just to do SEO or SEM (hello, internet geeks!) or promote myself. I put my heart & soul into it, and I try to make sure I will be responsible & objective as I can.

Anyway, let me give a quick lookback.

At my earlier post, I said that the basics of Technical Analysis include:
- How to know if the current price that we see on the news is a good price to get in
- How to know if the price is trending up or down
- How to know if we are in a bull market or a bear market


I will try to answer all these questions, using the stock charts that we have for our PCOMP or Philippine Composite Index.

Also, I'd like point out - as early as now - there may be people who may start asking why I'm divulging information that could be detrimental to their strategies. Or, some people may get overly paranoid saying, "Oh no! This guy is spilling out the secrets!"

Well, sorry.. but these are not secrets. There are a lot of resources out there. A few of which are here:
http://www.swing-trade-stocks.com/stock-market-books.html
Technical Analysis of Stock Trends by Robert D. Edwards and John Magee
Technical Analysis of the Financial Markets: A Comprehensive Guide to Trading Methods and Applications

[If you know of some great links or websites or books, please share them!]


Okay, so let's get on with it.


How to know through Stocks Charts that a stock is trending up/down (or bullish/bearish), or consolidating


Know your Trade Horizon

First, they say in life, as well as with business or investments, you have to KNOW THYSELF.

So, the very first question to ask then, is not "hey, could you tell me a stock I could pick now and tell me if it's trending up or down, so I could gain quickly". Hey, get-rich-quick-schemer, get outta here. I'm not here to do magic.

The right question, I guess for me, is this:
What is your RISK appetite?

Are you a trader, or doing it short-time?
Gusto mo ba maka-syota si LC, or si MEG Ryan?

Or, are you an investor, or doing it mid-term to long-term?
Ang gerlprenin/boyprenin o asawain si BELla, sTELla, or si MERyl Streep?


It doesn't actually matter if you are classifying yourself as such (trader or investor), the important thing here is that you know what your trade horizon is. Meaning, how do you look at your investments? Do you have a short-term or longer-term outlook?

If you find this hard to answer, saying "depende po e, minsan short term ako, na kapag natatalo na sa short-term nagiging long-term na po ako."
(Well, if this is your outlook, I don't think this is a good strategy po sir / ma'm.)


What is your Risk Appetite?

Okay... Let's try another question: Hanggang saan ang kaya ninyo i-risk?
Or: ok lang po ba sa inyo na iiwan ninyo ang stock investment ninyo for a year na hindi ito nagagalaw? Or, for a few months lang ang kaya mo? Or, maybe a few weeks, or a few days lang ba? 

Or baka po 'di na kayo mapakali, after a few days, 'di ka na mapigil na tignan ang stocks portfolio mo kada oras (kahit sarado ang stock market).. "ano, kumita na ba ako?? Nagbago na ba, umakyat na ba presyo?"

Kung ayan po ang symptoms ninyo.. baka po ibig sabihin ay more on short-term kayo. Or, pwede rin na nag-start pa lang talaga kayo at natututo pa lang, at di nyo pa gaano napag-iisipan.


So, by this, we could say your investment horizon can be determined by your risk appetite. If you are comfortable leaving your money invested on a stock, having studied and carefully researched on the company you chose, say in a few months or a few years - then you may have a longer term outlook. Also, those who prefer cost averaging methods look at a longer term return for their investment.

To make it short, you have to know yourself, and understand if you are here thinking on a short-term, mid-term or long term outlook.


So, in Technical Analysis, if you have a short-term outlook, you would probably look at the stock charts in DAILY or in WEEKLY views, or in 3 months, or maybe til 6 months views. For a longer-term outlook, you probably will look at the charts from time to time, and look more at 3-months, to 6-months, 1-year to 5-year charts.

Here is a sample for 3 months, running from January until March 2012:


You could see here that the Philippine Stock Market has been trending up and getting hot since January. The purple line on the graph, we could say, is the movement of the Stock Price (although my sample is the Philippine Composite or PCOMP index, so this is not a particular stock or company, but a set of companies composed together to form a composite or an index - it's like an average of all the stocks, from small caps to large cap stocks including blue chip stocks, so it could better represent the status of the Philippine Stock Market).

For now, let's not look at the graphs saying Volume, MACD, or RSI.


Here is a sample for 6 months, running from October 'til March 2012:


We could see here, through the purple line, that the Philippine Stock Market slowed down a bit from mid-October 'til about the end of the year.


Next Important Question: How do you know if a stock is going up or down?  


To answer this question, we have to define what is a TREND, then know what trendlines mean in Technical Trading.

Well, I don't know the formal definition of a trend, but it is similar to what they say in the news about a trending topic. Meaning pinaguusapan, or umuuso. But with this, we could also mean something is hindi na pinaguusapan, or nalalaos na.

So in stocks investing, when we talk about a trend, it simply means the stock is following a pattern. It is either going up or down. In technical analysis, we could easily see this in the charts. We could say a stock is going on an uptrend or a downtrend.

Let's use the Philippine stocks composite as our sample, this time using a 5-year sample chart:


Again, let's not look at the graphs saying Volume, MACD, or RSI for now.


Samples of Uptrends or Bullish trends:


On the graph above, I've indicated 3 instances of uptrends in the Philippine Stock Market for a 5-year period, indicated by the red lines. Try comparing the original graph with the one I've just shown above so you'll see what I mean.

These red lines are what we call the trendlines. Technical Analysts draw this on a graph (like the one above) so it would be easier to study their next moves and get projections. The graph that I use here is not an ordinary graph or stock chart. Try to look for Stock Chart apps or programs out there for your preferred PC operating system or mobile gadget. For me, I prefer using my Windows PC. The app that I use is from my online stock broker, CitisecOnline.com - a java chart is provided on their website when you become a member.


Downtrends or Bearish trends:


You'll know we are on a downtrend if we see all sorts of bad news and panic in the business section of our daily newspapers, sometimes echoing whatever is happening on other stock markets - especially the US stock market.


Technically Speaking 

In technical analysis, we could further define and more aptly state what an uptrend or a downtrend is.

Using a chart, we could see that an uptrend is characterized by a series of higher highs (HH) and higher lows (HL).

On the other hand, a downtrend is characterized by a series of lower highs (LH) and lower lows (LL).


In pictures or graphs:


Try going back on the charts that I've shown and try to see why I said it was an uptrend, or a downtrend.


My post is getting long. I have to cut it for now. Next time we'll see what it means by what the newspapers or stock market experts sometimes say as "consolidating", during times when our Philippine Stock Market is on a consolidation period.

Wednesday, March 21, 2012

The 2 Stock Market Approaches that Most People don't know about [and how we can use one of them to evaluate a Solar Investment] - Part 1

A friend of mine once told me (I think this was late last year), "hey Jeng, nagsisi-taasan na ang prices ng stocks ah. Nakita mo ba?"

I thought, parang nasa consolidation pa rin tayo as far as I know [and the current bull run that we have today started just around January or Feb 2012]. So I asked her, "how did you know?"

She said, "nakita ko sa dyaryo.."

She said the price of this certain stock (I think she mentioned  SMDC) has hit the roof and is now approaching P20. She caught my attention because, as far as i know from my last check: SMDC is one of the stocks I was following, and it was playing at the P8-P12  range. It could have been nearly impossible that it hit P20 that fast. Plus, during that time, the Europe Crisis was still getting hot.

I asked her, "Are you sure about this?"

She said yes.

I asked again, "how would you know that the stock price has 'hit the roof'?"

She said, "thru the newspapers. She said, it's on the Philippine Daily Inquirer."

"Ok," I said, "so, how then would you know or verify if the  newspaper is indeed right."

She said the newspaper told so. The headlines says so. "Also, it's listed on a table were all stocks are in there and you will see the current stock price," she added.

I reiterated.. "Ok, from what I know, what's listed in there are the stock symbols, the current stock price, the 52-day hi and low." I  asked again, "so how'd you know if the stock 'hit the roof' & is trending up?"

"I guess, the 52-day hi & low?" She was getting a bit unsure of her answer.

I finally told her, you don't easily see that on the news. You have to dig in further. I told her, "All you see is a reporting of what's happened on the previous day of stock action. When you base solely on the news, you're gonna end up getting IN or OUT of a stock at the last moment."

"You've got to know when a stock is trending up or down, why a stock is a bit cheap, why we say it's going up or is reaching it's peak. Yes, you can easily see that on the news, but it's not the whole story. Because if you do, then all the other people who are reading it will jump in and get that stock."

Just imagine people basing on the news and acting on what they see on the news.

All sorts of people just reacting, investing with no solid knowledge or measurable strategy. They are following what has been stated by a newspaper reporter, who may not necessarily be a Market Analyst, Strategist, or maybe not even a stock market investor. People jump in on the stock, with all the craziness, people filled with emotion - with excitement. And then suddenly a smart institutional investor sees the moment and seizes it. It happens. Your hard-earned money: goodbye!

-----------------------


What my friend was seeing in the news is mostly a reflection of only 1 side of the coin. When we talk about the stock market, we could say we have 2 main schools of thought or approaches - 1) those who look at the  perceived value of a stock based on the company's earnings and performance, which we call the "fundamental" aspect; and 2) those who look primarily at the movements of the stock price (using stock charting) to outline the performance of a stock, which is the "technical" aspect.

Who am I to say this? Am I an authority or certified analyst? Well, no. I am not a big expert (yet) on stocks, I'll be honest: I did gain some &  lose some, but at least I know the basics. And I try everyday to learn and expand my knowledge on everything about business and investing, including the darling Stock Market.

That is why when investing in stocks (or in any kind of business and investing, in general), I say, we also need to educate ourselves, do our own study, do our own research & readings. There are a lot of guys out there who can help. Bo Sanchez, whom  I'm sure a lot of Filipinos know about, has a blog at  "BoSanchez.ph". He conducts seminars regularly.

Let me show you a free e-book from Brother Bo.... "My maid invests  in the Stock Market". 
My Maid Invests in the Stock Market…

He is one of my mentors and I check on his blogs and seminars from time to time.

Also, my stockbroker, CitisecOnLine (COL) gives out trainings and seminars on investing in the Stock Market (which covers both the Fundamental and the Technical Aspect).

If you want to start looking at more aggressive options like the Stock market, I suggest you start with those.

Because I know, from learning from these mentors, that both the Fundamental and the Technical aspects are very important in determining stock price action, as well as in your decisions as to which stock or company you're gonna get invested in. How you could gain money on the stock market, or make it work for you so that you get earnings, or even passive income.

I'm not here to be very technical about this, and I'm also not gonna cover a lot about the Fundamental Analysis aspect.. but I will only show, again, the 'basics' of what they call Technical Analysis, or the scientific or organized study of stock price action.

The basics of Technical Analysis include:
- How to know if the current price that we see on the news is a good price (or, in terms of fundamental lingo, a "cheap" price) to get in
- How to know if the price is trending up, or down
- How to know if we are in a bull market, or a bear market (they say you are either bullish, or bearish - which is essentially the outlook or the risk appetite of the investor)

The topics in Technical Analysis is so wide-ranging, and I tell you -  it could be very dangerous if you only cover a few and not all of  the basics.

Just a disclaimer: what I'm gonna be showing you is just a few of  the basics, hopefully I can cover some others in later posts.

On the other hand, the "fundamental analysis" aspect, in it's purest form, is different in that it doesn't rely on charts and graphs. It relies on price-to-earnings ratio, the earnings of the company (say in the last 4 quarters, or the last quarter, or assessments in the 1st or 2nd half of the year), if a company is indeed earning something, does a company have debt or incurred some losses, do they have incoming big projects that could boost it's stock value, etc.

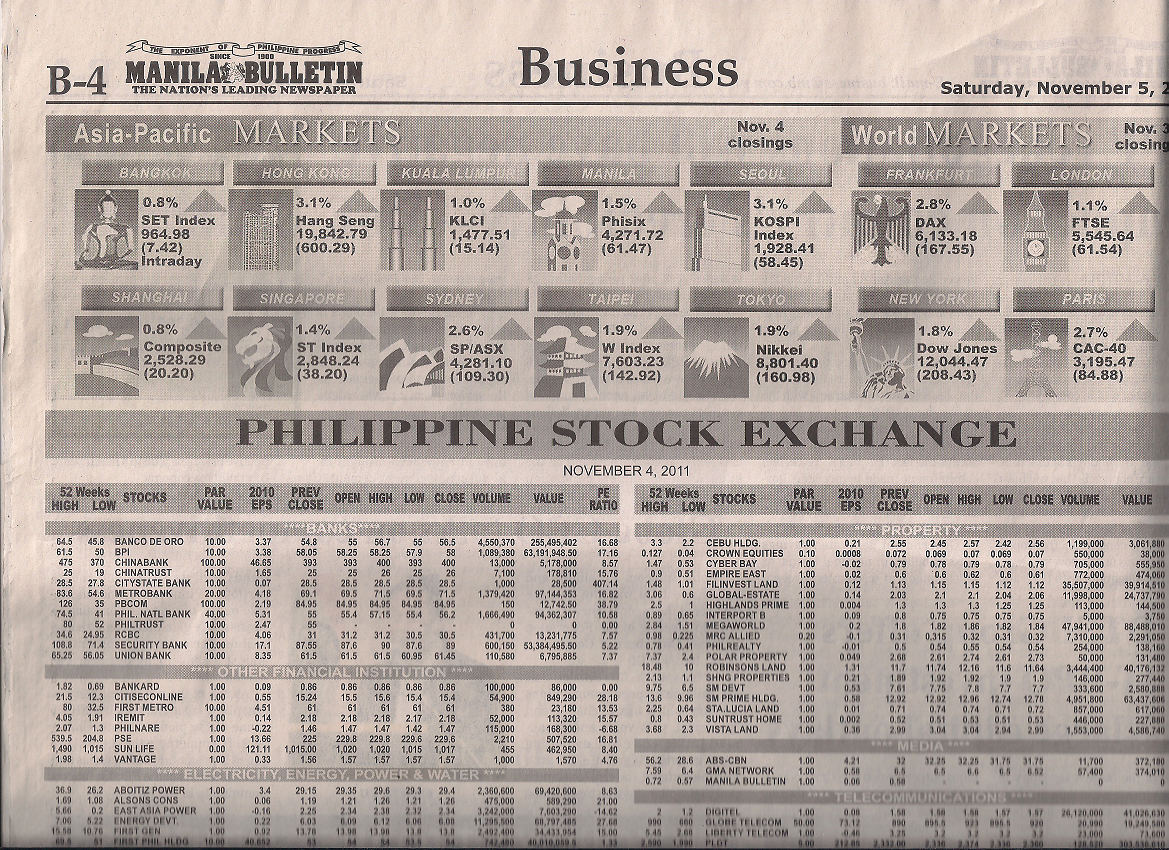
Here is a tool that fundamentalists use:


Yep. I know, it's a newspaper. It's a basic tool. But I'm not saying it's not important. All the data in there are very very valuable, if you know how to use it. I'm saying that sometimes, you don't get the whole story with a full-page listing of the current stock prices.

The main difference, now, is that Technical Analysis uses charts & graphs. It uses projections graphically, using charts to see and justify those projections. Some higher topics even use formulas, and Da Vinci codes (no, I'm just kidding; but it's a bit true because they have what they call Fibonacci retracements).

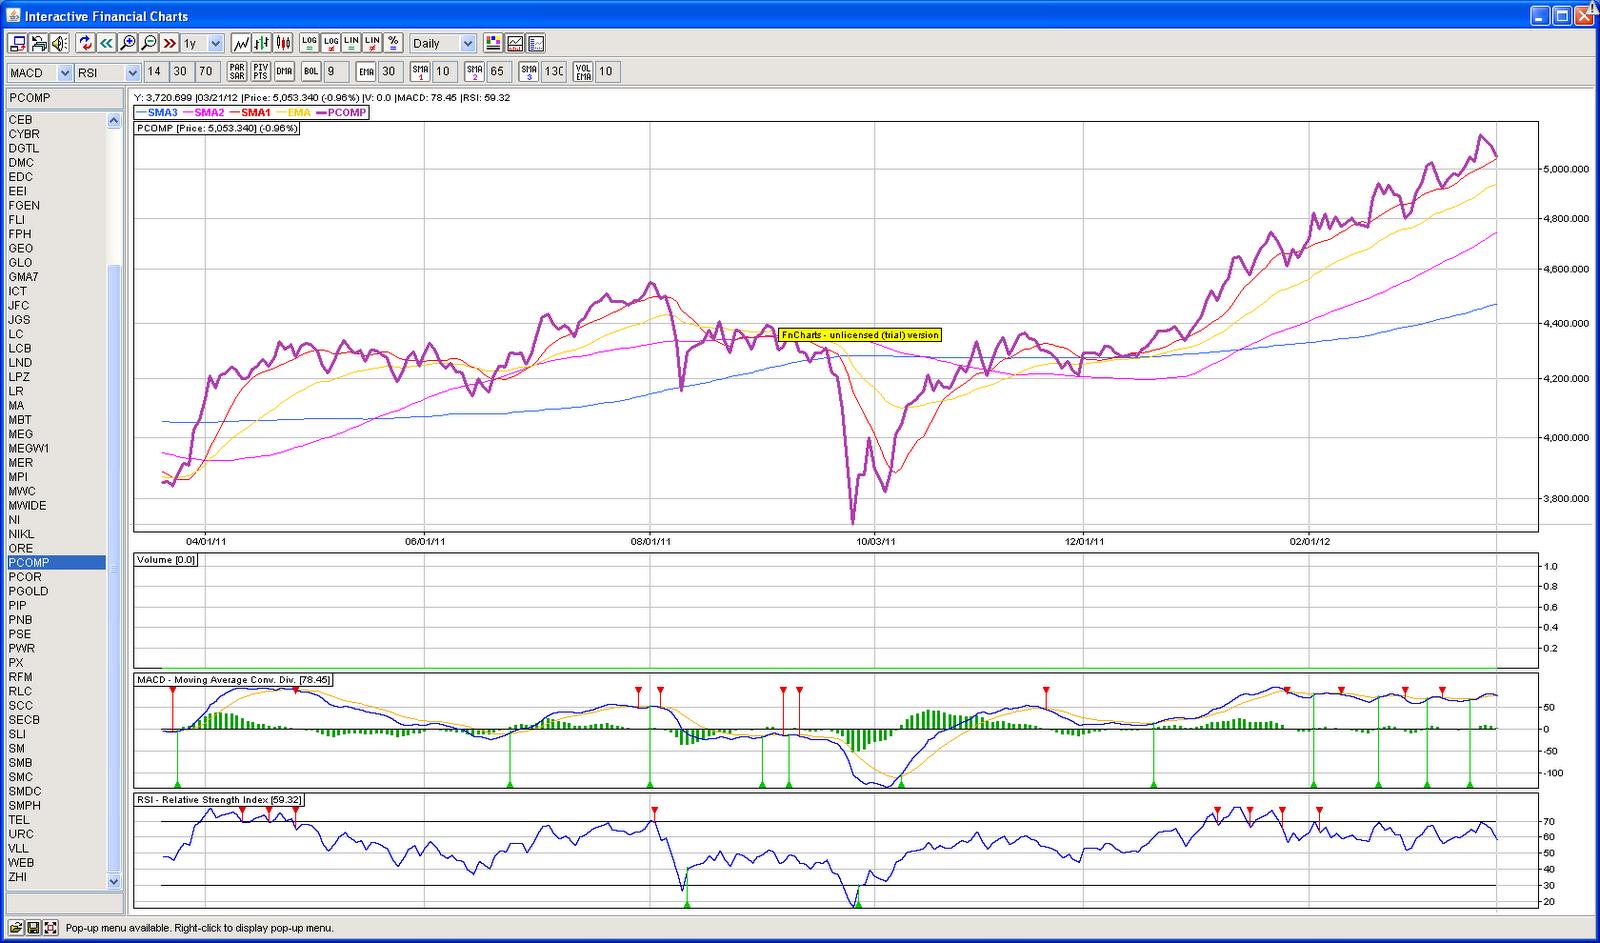
Here is a sample tool of what Technical Analysts use. This is what they call a "Stock Chart" (this picture is our current Philippine Stock Composites Index, or PCOMP, at the time I wrote this post):


Technical Analysis basically says the value of a stock (from what the Fundamentalists state as the perceived price or fair value) is already priced-in on the 'stock-price' which we can squarely see on the charts, meaning if the stock did not perform well fundamentally, say: it didn't earn last quarter or has incurred some losses, it will  show on the charts sooner or later. It will show that the stock price is gonna drop eventually.

That a movement on the price has some sort of a justification. Like for example, if a stock has suddenly moved up for no apparent reason, so that even fundamentalists can't explain it (say, a mining company just moved up so quick). Be careful because sooner or  later that price is gonna drop. Nothing can sustain a momentum if that momentum has no substance.


Wow. I didn't realize that it's gonna take that long for me to explain things. But I just wanted to let people know that I want to be careful in describing abstract or intangible things, because I don't want to be an  irresponsible writer who will get the ire of people. I want to explain the things I learn from my mentors as best as I can, and in the language that I know.

I consider myself still starting at business and investing, although I've been doing stocks for about 2 yrs already. I can be wrong at times (especially when I get to state some stocks which I  think would be good to pick - if that happens in the future), but it's important to point out the things that already have a foundation, or, like what Stephen Covey says "a map of the reality, not the territory" - those things that are based on  principles and are widely-considered as true, correct or objective. Just like the 2 schools of Stock Market Investing.

You can either be a pure fundamentalist, or a pure technical analyst. You can have balance between the two (which should be the correct way for most people, I should say - especially for those who are still starting & learning, or those who prefer less risks or those who have low-risk appetites or preferences), but these two are totally distinct and different approaches to Stock Market investing.

Sorry, I don't have anymore time for now. I will continue with this tomorrow, or as soon as possible, and try to evaluate the stock market (based on what COL has presented last night on their 2012 Stock Market Outlook), and how, like I said before, we will try to see Solar Systems as possibly a profitable investment - or may be a safer investment than most stocks, using charts analysis.

Wednesday, February 8, 2012

Bullish Stocks in the Philippines

I have been quiet for a while now when it comes to the state of Philippine Stocks.

I just chanced upon it right now and just out of curiosity, I checked the technical data of our Composite Index -  this is for today, Feb. 9, 2012.

Here it is:


I didn't know that Philippine stocks has been very bullish for a time now. It broke the past records set last year.  It's only gonna get better. If I had the money now, I would wisely choose promising stocks. I can't say which ones, but you can try checking some (like PGOLD / PureGold, and maybe SMPH / SM Prime Holdings) and see for yourself. I am not endorsing these stocks. I just looked briefly on their charts and had an initial check on some stocks that I feel were good the last time I checked. If you are not a member of an Online Stock Brokers, like CitisecOnline (which I am a member of) - you can check with our Philippine Stocks Exchange (PSE) website for the stock quotes and charts [see www.pse.com.ph]. I'm just saying you need to know Fundamental and Technical Analysis, and you need to have discipline, before venturing into Stocks. NO EMOTIONS allowed.

All I can say is....

WOW.