Hi everyone!
I sincerely apologize for having gone for so long, when I promised I will expand further on my earlier post:
The 2 Stock Market Approaches that Most People don't know about [and how we can use one of them to evaluate a Solar Investment] - Part 1.
It takes time for me to write, it can be mentally and emotionally draining because I write not just to do SEO or SEM (hello, internet geeks!) or promote myself. I put my heart & soul into it, and I try to make sure I will be responsible & objective as I can.
Anyway, let me give a quick lookback.
At my earlier post, I said that the basics of Technical Analysis include:
- How to know if the current price that we see on the news is a good price to get in
- How to know if the price is trending up or down
- How to know if we are in a bull market or a bear market
I will try to answer all these questions, using the stock charts that we have for our PCOMP or Philippine Composite Index.
Also, I'd like point out - as early as now - there may be people who may start asking why I'm divulging information that could be detrimental to their strategies. Or, some people may get overly paranoid saying, "Oh no! This guy is spilling out the secrets!"
Well, sorry.. but these are not secrets. There are a lot of resources out there. A few of which are here:
http://www.swing-trade-stocks.com/stock-market-books.html
Technical Analysis of Stock Trends by Robert D. Edwards and John Magee
Technical Analysis of the Financial Markets: A Comprehensive Guide to Trading Methods and Applications
[If you know of some great links or websites or books, please share them!]
Okay, so let's get on with it.
How to know through Stocks Charts that a stock is trending up/down (or bullish/bearish), or consolidating
Know your Trade Horizon
First, they say in life, as well as with business or investments, you have to KNOW THYSELF.
So, the very first question to ask then, is not "hey, could you tell me a stock I could pick now and tell me if it's trending up or down, so I could gain quickly". Hey, get-rich-quick-schemer, get outta here. I'm not here to do magic.
The right question, I guess for me, is this:
What is your RISK appetite?
Are you a trader, or doing it short-time?
Gusto mo ba maka-syota si LC, or si MEG Ryan?
Or, are you an investor, or doing it mid-term to long-term?
Ang gerlprenin/boyprenin o asawain si BELla, sTELla, or si MERyl Streep?
It doesn't actually matter if you are classifying yourself as such (trader or investor), the important thing here is that you know what your trade horizon is. Meaning, how do you look at your investments? Do you have a short-term or longer-term outlook?
If you find this hard to answer, saying "depende po e, minsan short term ako, na kapag natatalo na sa short-term nagiging long-term na po ako."
(Well, if this is your outlook, I don't think this is a good strategy po sir / ma'm.)
What is your Risk Appetite?
Okay... Let's try another question: Hanggang saan ang kaya ninyo i-risk?
Or: ok lang po ba sa inyo na iiwan ninyo ang stock investment ninyo for a year na hindi ito nagagalaw? Or, for a few months lang ang kaya mo? Or, maybe a few weeks, or a few days lang ba?
Or baka po 'di na kayo mapakali, after a few days, 'di ka na mapigil na tignan ang stocks portfolio mo kada oras (kahit sarado ang stock market).. "ano, kumita na ba ako?? Nagbago na ba, umakyat na ba presyo?"
Kung ayan po ang symptoms ninyo.. baka po ibig sabihin ay more on short-term kayo. Or, pwede rin na nag-start pa lang talaga kayo at natututo pa lang, at di nyo pa gaano napag-iisipan.
So, by this, we could say your investment horizon can be determined by your risk appetite. If you are comfortable leaving your money invested on a stock, having studied and carefully researched on the company you chose, say in a few months or a few years - then you may have a longer term outlook. Also, those who prefer cost averaging methods look at a longer term return for their investment.
To make it short, you have to know yourself, and understand if you are here thinking on a short-term, mid-term or long term outlook.
So, in Technical Analysis, if you have a short-term outlook, you would probably look at the stock charts in DAILY or in WEEKLY views, or in 3 months, or maybe til 6 months views. For a longer-term outlook, you probably will look at the charts from time to time, and look more at 3-months, to 6-months, 1-year to 5-year charts.
Here is a sample for 3 months, running from January until March 2012:

You could see here that the Philippine Stock Market has been trending up and getting hot since January. The purple line on the graph, we could say, is the movement of the Stock Price (although my sample is the Philippine Composite or PCOMP index, so this is not a particular stock or company, but a set of companies composed together to form a composite or an index - it's like an average of all the stocks, from small caps to large cap stocks including blue chip stocks, so it could better represent the status of the Philippine Stock Market).
For now, let's not look at the graphs saying Volume, MACD, or RSI.
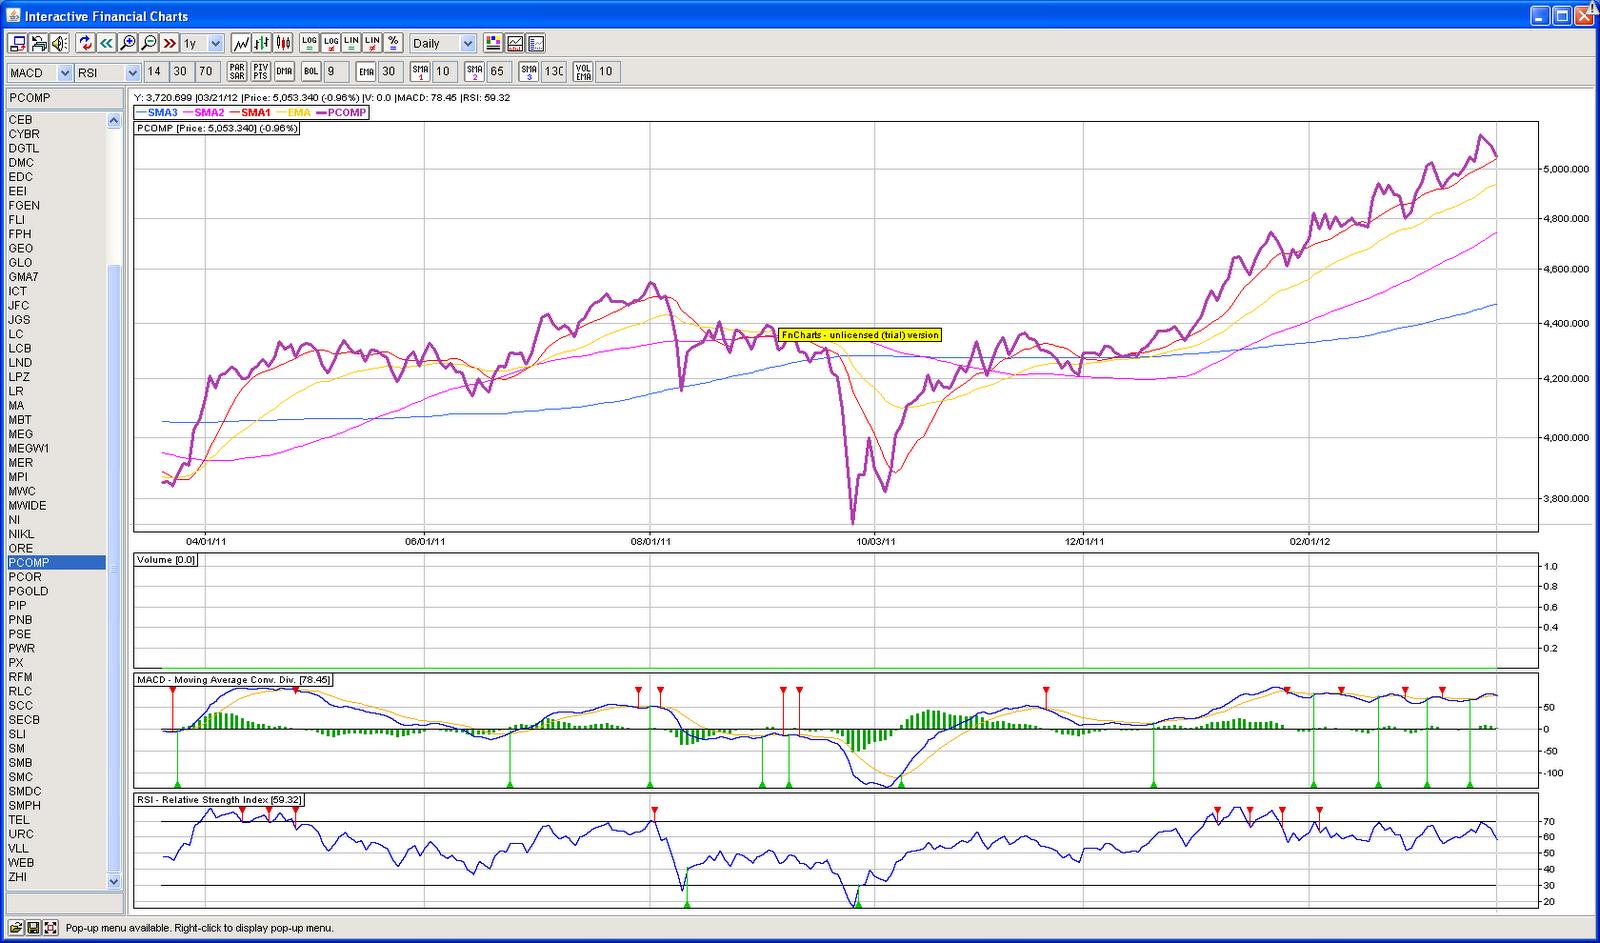
Here is a sample for 6 months, running from October 'til March 2012:

We could see here, through the purple line, that the Philippine Stock Market slowed down a bit from mid-October 'til about the end of the year.
Next Important Question: How do you know if a stock is going up or down?
To answer this question, we have to define what is a TREND, then know what trendlines mean in Technical Trading.
Well, I don't know the formal definition of a trend, but it is similar to what they say in the news about a trending topic. Meaning pinaguusapan, or umuuso. But with this, we could also mean something is hindi na pinaguusapan, or nalalaos na.
So in stocks investing, when we talk about a trend, it simply means the stock is following a pattern. It is either going up or down. In technical analysis, we could easily see this in the charts. We could say a stock is going on an uptrend or a downtrend.
Let's use the Philippine stocks composite as our sample, this time using a 5-year sample chart:

Again, let's not look at the graphs saying Volume, MACD, or RSI for now.
Samples of Uptrends or Bullish trends:

On the graph above, I've indicated 3 instances of uptrends in the Philippine Stock Market for a 5-year period, indicated by the red lines. Try comparing the original graph with the one I've just shown above so you'll see what I mean.
These red lines are what we call the trendlines. Technical Analysts draw this on a graph (like the one above) so it would be easier to study their next moves and get projections. The graph that I use here is not an ordinary graph or stock chart. Try to look for Stock Chart apps or programs out there for your preferred PC operating system or mobile gadget. For me, I prefer using my Windows PC. The app that I use is from my online stock broker, CitisecOnline.com - a java chart is provided on their website when you become a member.
Downtrends or Bearish trends:

You'll know we are on a downtrend if we see all sorts of bad news and panic in the business section of our daily newspapers, sometimes echoing whatever is happening on other stock markets - especially the US stock market.
Technically Speaking
In technical analysis, we could further define and more aptly state what an uptrend or a downtrend is.
Using a chart, we could see that an uptrend is characterized by a series of higher highs (HH) and higher lows (HL).
On the other hand, a downtrend is characterized by a series of lower highs (LH) and lower lows (LL).
In pictures or graphs:

Try going back on the charts that I've shown and try to see why I said it was an uptrend, or a downtrend.
My post is getting long. I have to cut it for now. Next time we'll see what it means by what the newspapers or stock market experts sometimes say as "consolidating", during times when our Philippine Stock Market is on a consolidation period.
nice post jeng
ReplyDelete:)
Hi Teng! Thanks! God bless! :)
DeleteVery informative site.. thanks for sharing..
ReplyDeleteI wanted to thank you for this excellent read!! I definitely loved every little bit of it. I have you bookmarked your site to check out the new stuff you post. Saham Aplikasi
ReplyDelete